P-probmodel writes when the script runsDictionary of Applied Machine Learning · model
Numerical companion to the entry model: it recomputes what the entry states and prints one line per check
One block per paragraph of the entry (marked [P...]): each block verifies numerically what the corresponding statement asserts. Self-contained (numpy/matplotlib only), fixed seed.
Run it with python3 model.py, from any directory — it writes its output files into the current directory. Requires NumPy and Matplotlib only, and uses fixed seeds, so the printed numbers reproduce exactly. Download model.py
One cell per block of the script: the code, and what that code printed when it last ran here
"""
model.py — numerical companion to the glossary entry 'model'.

One block per paragraph of the entry (marked [P...]): each block verifies
numerically what the corresponding statement asserts. Self-contained
(numpy/matplotlib only), fixed seed.

Blocks
------
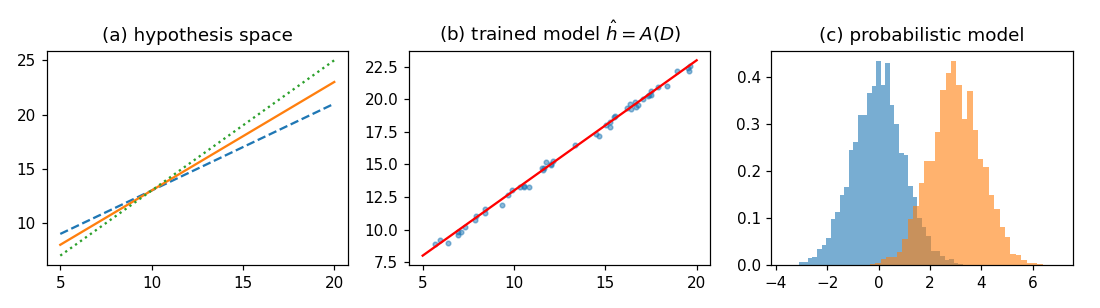
[P-hypospace] Sense 1 — the model as the hypothesis space: temperature
              prediction commits to a set of candidate maps (three
              linear maps, as in the entry's figure panel (a)); every
              element is a map producing predictions.
[P-trained]   Sense 2 — the trained model as the learned hypothesis:
              the ML map A acts on a trainset and selects the single
              element h-hat = A(D) of the hypothesis space
              that best fits the trainset (panel (b)); software-library usage.
[P-probmodel] Sense 3 — the probabilistic model as a family of
              probability distributions: each member is a data
              generator, and datasets generated from the two members of
              the family are statistically distinguishable (panel (c)).

Outputs
-------
model.png : preview figure (checking only).

Data generated by pythondemos/model.py.
"""

import numpy as np
import matplotlib

matplotlib.use("Agg")
import matplotlib.pyplot as plt

rng = np.random.default_rng(42)
report = []


def check(name, ok):
    report.append((name, bool(ok)))
    print(f"  [{'ok' if ok else 'FAIL'}] {name}")
Sense 1 — the model as the hypothesis space: temperature prediction commits to a set of candidate maps (three linear maps, as in the entry's figure panel (a)); every element is a map producing predictions.
print("[P-hypospace] model as the hypothesis space (a set of maps)")
H = [lambda x: 0.8 * x + 5.0,
     lambda x: 1.0 * x + 3.0,
     lambda x: 1.2 * x + 1.0]                     # three candidate maps
x_morning = 6.0    # note: at x = 10 all three maps happen to agree
preds = [h(x_morning) for h in H]
check("the model is a set of candidate maps (three linear maps)",
      len(H) == 3 and len(set(preds)) == 3)
check("every element is a map: it delivers a prediction",
      all(np.isfinite(p) for p in preds))
[P-hypospace] model as the hypothesis space (a set of maps)
  [ok] the model is a set of candidate maps (three linear maps)
  [ok] every element is a map: it delivers a prediction
Sense 2 — the trained model as the learned hypothesis: the ML map A acts on a trainset and selects the single element h-hat = A(D) of the hypothesis space that best fits the trainset (panel (b)); software-library usage.
print("[P-trained] trained model = learned hypothesis A(D)")
m = 50
x_tr = rng.uniform(5, 20, m)
y_tr = 1.0 * x_tr + 3.0 + 0.3 * rng.normal(size=m)   # truth = H[1]
emp_risk = [np.mean((y_tr - h(x_tr)) ** 2) for h in H]
h_hat = H[int(np.argmin(emp_risk))]
check("the ML map selects a single element of the hypothesis space",
      h_hat in H)
check("A(D) picks the best-fitting map (the true map here)",
      int(np.argmin(emp_risk)) == 1)
check("the trained model is itself a map (usable for prediction)",
      np.isfinite(h_hat(12.0)))
[P-trained] trained model = learned hypothesis A(D)
  [ok] the ML map selects a single element of the hypothesis space
  [ok] A(D) picks the best-fitting map (the true map here)
  [ok] the trained model is itself a map (usable for prediction)
Sense 3 — the probabilistic model as a family of probability distributions: each member is a data generator, and datasets generated from the two members of the family are statistically distinguishable (panel (c)).
print("[P-probmodel] probabilistic model = family of distributions")
family = [{"mean": 0.0, "std": 1.0}, {"mean": 3.0, "std": 1.0}]
data0 = rng.normal(family[0]["mean"], family[0]["std"], 5000)
data1 = rng.normal(family[1]["mean"], family[1]["std"], 5000)
check("each member of the family generates iid data points",
      data0.shape == (5000,) and data1.shape == (5000,))
check("datasets from different members are distinguishable",
      abs(data0.mean() - data1.mean()) > 2.5)
check("the empirical means identify the generating member",
      abs(data0.mean() - family[0]["mean"]) < 0.1
      and abs(data1.mean() - family[1]["mean"]) < 0.1)

# ------------------------------------------------------------ preview
fig, ax = plt.subplots(1, 3, figsize=(10, 2.8))
xx = np.linspace(5, 20, 50)
for h, st in zip(H, ("--", "-", ":")):
    ax[0].plot(xx, h(xx), st)
ax[0].set_title("(a) hypothesis space")
ax[1].plot(x_tr, y_tr, "o", ms=3, alpha=0.5)
ax[1].plot(xx, h_hat(xx), "r-")
ax[1].set_title("(b) trained model $\\hat{h} = A(D)$")
ax[2].hist(data0, bins=40, alpha=0.6, density=True)
ax[2].hist(data1, bins=40, alpha=0.6, density=True)
ax[2].set_title("(c) probabilistic model")
fig.tight_layout()
fig.savefig("model.png", dpi=110)
print(f"\n{sum(ok for _, ok in report)}/{len(report)} checks passed")
assert all(ok for _, ok in report)
[P-probmodel] probabilistic model = family of distributions
  [ok] each member of the family generates iid data points
  [ok] datasets from different members are distinguishable
  [ok] the empirical means identify the generating member

8/8 checks passed
P-probmodel writes when the script runs