P-repr writes when the script runsDictionary of Applied Machine Learning · hypothesis
Numerical companion to the entry hypothesis: it recomputes what the entry states and prints one line per check
One block per paragraph of the entry (marked [P...]): each block verifies numerically what the corresponding statement asserts. Self-contained (numpy/matplotlib only), fixed seed.
Run it with python3 hypothesis.py, from any directory — it writes its output files into the current directory. Requires NumPy and Matplotlib only, and uses fixed seeds, so the printed numbers reproduce exactly. Download hypothesis.py
One cell per block of the script: the code, and what that code printed when it last ran here
"""
hypothesis.py — numerical companion to the glossary entry 'hypothesis'.

One block per paragraph of the entry (marked [P...]): each block verifies
numerically what the corresponding statement asserts. Self-contained
(numpy/matplotlib only), fixed seed.

Blocks
------
[P-def]   A hypothesis is a map h: X -> Y: a temperature predictor
          returns a prediction y-hat = h(x) for every feature value, and
          the same features always yield the same prediction.
[P-learn] ML searches a SUBSET of Y^X: for finite spaces |X| = 4,
          |Y| = 2 the set of all maps has |Y|^|X| = 16 elements, while
          the subset of threshold maps has only 5 — restricting the
          search is what makes learning with finite resources possible.
          ERM over the trainset returns the element of the subset with
          minimal empirical risk, achieving y ~ h(x).
[P-repr]  Different hypothesis spaces represent their maps differently:
          the same underlying map is represented as a polynomial
          coefficient vector, as an executable Python function, and as
          a decision-tree flow chart — all three agree on every input.

Outputs
-------
hypothesis.png : preview figure (checking only).

Data generated by pythondemos/hypothesis.py.
"""

import numpy as np
import matplotlib

matplotlib.use("Agg")
import matplotlib.pyplot as plt

rng = np.random.default_rng(42)
report = []


def check(name, ok):
    report.append((name, bool(ok)))
    print(f"  [{'ok' if ok else 'FAIL'}] {name}")
A hypothesis is a map h: X -> Y: a temperature predictor returns a prediction y-hat = h(x) for every feature value, and the same features always yield the same prediction.
print("[P-def] a hypothesis maps features to predictions")
h = lambda x: 0.9 * x + 4.0                      # tomorrow ~ h(morning temp)
x_morning = np.array([8.0, 12.0, 15.0])
y_hat = h(x_morning)
check("h returns a prediction for every feature value",
      y_hat.shape == x_morning.shape)
check("h is a map: same features, same prediction",
      np.array_equal(h(x_morning), y_hat))
[P-def] a hypothesis maps features to predictions
  [ok] h returns a prediction for every feature value
  [ok] h is a map: same features, same prediction
ML searches a SUBSET of Y^X: for finite spaces |X| = 4, |Y| = 2 the set of all maps has |Y|^|X| = 16 elements, while the subset of threshold maps has only 5 — restricting the search is what makes learning with finite resources possible. ERM over the trainset returns the element of the subset with minimal empirical risk, achieving y ~ h(x).
print("[P-learn] the search is restricted to a subset of Y^X")
X_space = [0, 1, 2, 3]                            # |X| = 4
Y_space = [0, 1]                                  # |Y| = 2
from itertools import product
all_maps = list(product(Y_space, repeat=len(X_space)))
thresh_maps = [tuple(int(x >= t) for x in X_space) for t in range(5)]
check("|Y^X| = |Y|^|X| = 16 maps", len(all_maps) == 2 ** 4 == 16)
check("the threshold hypothesis space is a strict subset (5 of 16)",
      len(set(thresh_maps)) == 5
      and set(thresh_maps) <= set(all_maps))
# ERM over the subset achieves y ~ h(x)
xs = rng.choice(X_space, 40)
ys = (xs >= 2).astype(int)                        # true threshold t = 2
emp = [np.mean([m[x] != y for x, y in zip(xs, ys)]) for m in thresh_maps]
h_hat = thresh_maps[int(np.argmin(emp))]
check("ERM over the subset finds the true threshold map",
      h_hat == tuple(int(x >= 2) for x in X_space))
check("the learned hypothesis achieves y = h(x) on the trainset",
      min(emp) == 0)
[P-learn] the search is restricted to a subset of Y^X
  [ok] |Y^X| = |Y|^|X| = 16 maps
  [ok] the threshold hypothesis space is a strict subset (5 of 16)
  [ok] ERM over the subset finds the true threshold map
  [ok] the learned hypothesis achieves y = h(x) on the trainset
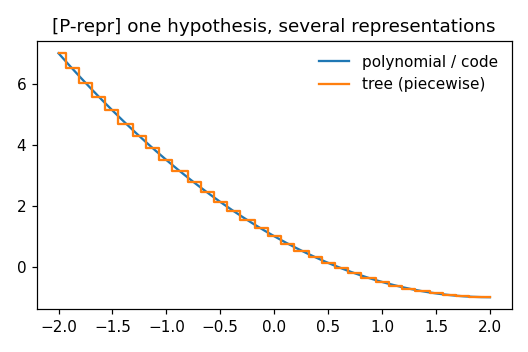
Different hypothesis spaces represent their maps differently: the same underlying map is represented as a polynomial coefficient vector, as an executable Python function, and as a decision-tree flow chart — all three agree on every input.
print("[P-repr] one map, three representations")
w_poly = np.array([1.0, -2.0, 0.5])               # h(x) = 1 - 2x + 0.5 x^2
h_poly = lambda x: sum(w * x**j for j, w in enumerate(w_poly))
def h_code(x):                                    # executable source code
    return 1.0 - 2.0 * x + 0.5 * x * x
def h_tree(x):                                    # flow chart of comparisons
    # piecewise-constant approximation on a grid: a depth-3 tree
    return h_poly(np.round(x * 8) / 8)
grid = np.linspace(-2, 2, 33)                     # tree grid points
check("polynomial and source-code representations agree everywhere",
      np.allclose(h_poly(grid), h_code(grid)))
check("the flow-chart (tree) representation agrees on its grid",
      np.allclose(h_tree(grid), h_poly(grid)))

# ------------------------------------------------------------ preview
fig, ax = plt.subplots(figsize=(4.8, 3.2))
xx = np.linspace(-2, 2, 200)
ax.plot(xx, h_poly(xx), label="polynomial / code")
ax.step(xx, h_tree(xx), where="mid", label="tree (piecewise)")
ax.legend(frameon=False)
ax.set_title("[P-repr] one hypothesis, several representations")
fig.tight_layout()
fig.savefig("hypothesis.png", dpi=110)
print(f"\n{sum(ok for _, ok in report)}/{len(report)} checks passed")
assert all(ok for _, ok in report)
[P-repr] one map, three representations
  [ok] polynomial and source-code representations agree everywhere
  [ok] the flow-chart (tree) representation agrees on its grid

8/8 checks passed
P-repr writes when the script runs