P-table writes when the script runsDictionary of Applied Machine Learning · dataset
Numerical companion to the entry dataset: it recomputes what the entry states and prints one line per check
One block per paragraph of the entry (marked [P...]): each block verifies numerically what the corresponding statement asserts. Self-contained (numpy/matplotlib only), fixed seed.
Run it with python3 dataset.py, from any directory — it writes its output files into the current directory. Requires NumPy and Matplotlib only, and uses fixed seeds, so the printed numbers reproduce exactly. Download dataset.py
One cell per block of the script: the code, and what that code printed when it last ran here
"""
dataset.py — numerical companion to the glossary entry 'dataset'.

One block per paragraph of the entry (marked [P...]): each block verifies
numerically what the corresponding statement asserts. Self-contained
(numpy/matplotlib only), fixed seed.

Blocks
------
[P-setsample] Two readings of 'dataset': strictly a set of distinct data
              points (no order, no repetitions) vs the ML usage as a
              sample (an indexed sequence that may repeat). A sequence
              with a repeated data point has m = 4 entries but only 3
              distinct elements, and reordering the sequence leaves the
              underlying set unchanged.
[P-table]     The relational-model reading: a table whose rows are data
              points and whose columns are attributes (the cow table of
              the entry). ML methods use the attribute columns as
              features or the label; the row order is immaterial — the
              least-squares fit computed from a row-shuffled table is
              identical.

Outputs
-------
dataset.png : preview figure (checking only).

Data generated by pythondemos/dataset.py.
"""

import numpy as np
import matplotlib

matplotlib.use("Agg")
import matplotlib.pyplot as plt

rng = np.random.default_rng(42)
report = []


def check(name, ok):
    report.append((name, bool(ok)))
    print(f"  [{'ok' if ok else 'FAIL'}] {name}")
Two readings of 'dataset': strictly a set of distinct data points (no order, no repetitions) vs the ML usage as a sample (an indexed sequence that may repeat). A sequence with a repeated data point has m = 4 entries but only 3 distinct elements, and reordering the sequence leaves the underlying set unchanged.
print("[P-setsample] set of distinct points vs indexed sample")
z1, z2, z3 = np.array([1.0, 2.0]), np.array([3.0, 1.0]), np.array([2.0, 2.0])
sample = np.stack([z1, z2, z1, z3])              # position 1 and 3 repeat
as_set = np.unique(sample, axis=0)
check("the sample has m = 4 indexed entries", sample.shape[0] == 4)
check("the underlying set has only 3 distinct data points",
      as_set.shape[0] == 3)
perm = rng.permutation(4)
check("reordering the sample leaves the set unchanged",
      np.array_equal(np.unique(sample[perm], axis=0), as_set))
[P-setsample] set of distinct points vs indexed sample
  [ok] the sample has m = 4 indexed entries
  [ok] the underlying set has only 3 distinct data points
  [ok] reordering the sample leaves the set unchanged
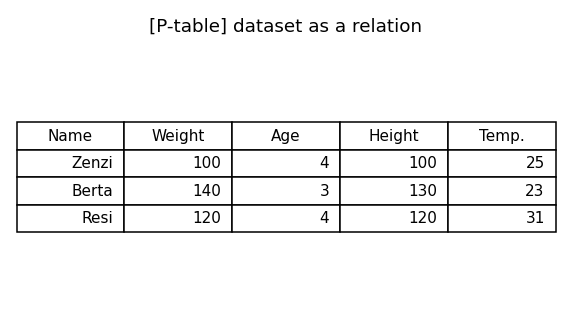
The relational-model reading: a table whose rows are data points and whose columns are attributes (the cow table of the entry). ML methods use the attribute columns as features or the label; the row order is immaterial — the least-squares fit computed from a row-shuffled table is identical.
print("[P-table] relational table: rows = data points, columns = attributes")
# the entry's cow table: Name, Weight, Age, Height, Stomach temperature
names = np.array(["Zenzi", "Berta", "Resi"])
table = np.array([[100.0, 4.0, 100.0, 25.0],
                  [140.0, 3.0, 130.0, 23.0],
                  [120.0, 4.0, 120.0, 31.0]])
X = table[:, [0, 1, 2]]                          # features: weight, age, height
y = table[:, 3]                                  # label: stomach temperature
check("each row is one data point, each column one attribute",
      table.shape == (3, 4))
w = np.linalg.lstsq(np.c_[X, np.ones(3)], y, rcond=None)[0]
perm = rng.permutation(3)
w_shuffled = np.linalg.lstsq(np.c_[X[perm], np.ones(3)], y[perm],
                             rcond=None)[0]
check("row order is immaterial: shuffled table gives the same fit",
      np.allclose(w, w_shuffled, atol=1e-8))
check("attribute domains bound the columns (weights within [100, 140])",
      X[:, 0].min() >= 100 and X[:, 0].max() <= 140)

# ------------------------------------------------------------ preview
fig, ax = plt.subplots(figsize=(5.2, 3.0))
ax.axis("off")
cell_text = [[n] + [f"{v:g}" for v in row]
             for n, row in zip(names, table)]
tab = ax.table(cellText=cell_text,
               colLabels=["Name", "Weight", "Age", "Height", "Temp."],
               loc="center")
tab.scale(1, 1.4)
ax.set_title("[P-table] dataset as a relation")
fig.tight_layout()
fig.savefig("dataset.png", dpi=110)
print(f"\n{sum(ok for _, ok in report)}/{len(report)} checks passed")
assert all(ok for _, ok in report)
[P-table] relational table: rows = data points, columns = attributes
  [ok] each row is one data point, each column one attribute
  [ok] row order is immaterial: shuffled table gives the same fit
  [ok] attribute domains bound the columns (weights within [100, 140])

6/6 checks passed
P-table writes when the script runs